


 Like
Like Share
Share
 Report
Suggestions for Creating Generative Pages in Power Apps
Below are six suggestions to maximize both the efficiency and the impact of your generative page.
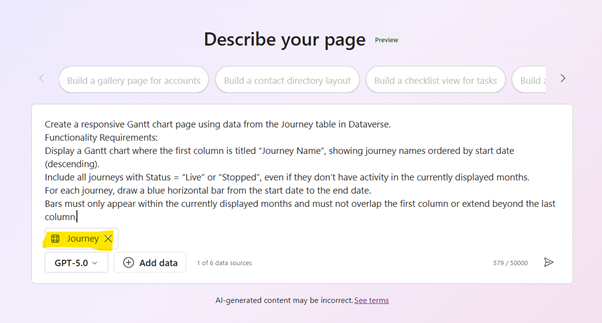
Create a responsive Gantt chart page using data from the Journey table in Dataverse.
Functionality Requirements:
Display a Gantt chart where the first column is titled “Journey Name”, showing journey names ordered by start date (descending).
Include all journeys with Status = “Live” or “Stopped”, even if they don’t have activity in the currently displayed months.
For each journey, draw a blue horizontal bar from the start date to the end date.
Bars must only appear within the currently displayed months and must not overlap the first column or extend beyond the last column.
Note that, the tables to be used must be added to the prompt, we must be added as a data source in the selection marked in bold (in the editor you can open the table selector by using a “/”). If the data source has been specified correctly, it should look like this:
Fix the width of the first column and wrap text if names are too long.
Horizontally, show months starting from the current month, displaying 3 months into the future.
Each column represents a week, starting on Monday, and months should be labelled as “MM-YY”.
If no end date is provided, assume it ends 24 hours after the start date.
Add left and right arrow buttons above the chart on the top-right corner to shift the displayed months by one month backward or forward.
These navigation buttons must remain visible at all times.
Ensure the chart fits horizontally within the screen and scrolls vertically if there are too many journeys.
So, we can put together this image and full set of instructions
Create a responsive Gantt chart page using data from the Journey table in Dataverse.
Functionality Requirements:
Display a Gantt chart where the first column is titled “Journey Name”, showing journey names ordered by start date (descending).
Include all journeys with Status = “Live” or “Stopped”, even if they don’t have activity in the currently displayed months.
For each journey, draw a blue horizontal bar from the start date to the end date.
Bars must only appear within the currently displayed months and must not overlap the first column or extend beyond the last column.
Fix the width of the first column and wrap text if names are too long.
Horizontally, show months starting from the current month, displaying 3 months into the future.
Each column represents a week, starting on Monday, and months should be labelled as “MM-YY”.
If no end date is provided, assume it ends 24 hours after the start date.
Add left and right arrow buttons above the chart on the top-right corner to shift the displayed months by one month backward or forward.
These navigation buttons must remain visible at all times.
Ensure the chart fits horizontally within the screen and scrolls vertically if there are too many journeys.
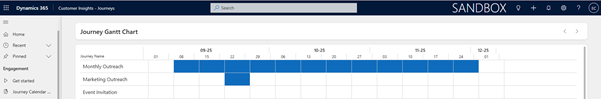
And we are able to get a to a page that looks like this:
Add drill-down when clicking the journey name. When the name is clicked navigate to the journey form for the journey.
Once this is processed, the output will change and the names are added as links.
But more importantly, this serves as reminder that the process of working with Generative Pages will be one of frequent iterations, adding instructions to fine tune the data, look and feel, navigation, etc. of the page.
Iteration is not only something to consider as the final touches. Working with prompts is an iterative process. The first attempts may not produce the desired results so be prepared to use the Start Over feature and start your prompt again. Because of this, it is recommended that you keep a copy of the prompt you are using and tweaking so you know what is working and not. You may also want to consider using M365’s Prompt Coach app (Prompt Coach) which can provide useful assistance in creating prompt that the generative pages are able to better understand.
Introduction
A recent enhancement to Power Apps is the possibility to create custom pages using natural language (Generate a page using natural language with model-driven apps in Power Apps - Power Apps | Microsoft Learn). With this feature, app developers can quickly use AI to design and develop pages based on user prompts. To illustrate some key suggestions, let’s walk through a use case: a marketing department wishes to create a Power Apps page that displays their Customer Insights Journeys visually, mapped onto a Gantt Chart.Below are six suggestions to maximize both the efficiency and the impact of your generative page.
1. Start with the Data You Want: Filter and Pick the Right Table and Columns
Begin at the source. Before even thinking of design or controls, clarify exactly which data you want to surface. In our example, the marketing team is interested in visualizing the various customer journeys they’ve set up in Customer Insights Journeys. This means identifying the precise table and identifying the most relevant columns, such as Journey Name, Start Date, End Date, Status, and Owner. If your table is rich with fields, apply filters up front: only pull journeys active in the last six months, for instance, or only those tied to a particular campaign.
Taking this into account, we can start our prompt with the following instructions:
Taking this into account, we can start our prompt with the following instructions:
Create a responsive Gantt chart page using data from the Journey table in Dataverse.
Functionality Requirements:
Display a Gantt chart where the first column is titled “Journey Name”, showing journey names ordered by start date (descending).
Include all journeys with Status = “Live” or “Stopped”, even if they don’t have activity in the currently displayed months.
For each journey, draw a blue horizontal bar from the start date to the end date.
Bars must only appear within the currently displayed months and must not overlap the first column or extend beyond the last column.
Note that, the tables to be used must be added to the prompt, we must be added as a data source in the selection marked in bold (in the editor you can open the table selector by using a “/”). If the data source has been specified correctly, it should look like this:
2. Indicate Label Formatting and Exception Handling
Label formatting makes or breaks usability. Specify in your prompt how you want labels—such as journey names or dates—presented. Also, plan for outliers and exceptions. If a journey name is especially long, does it truncate neatly, wrap onto another line, or trigger a tooltip with the full text?
So, we add to our prompt:
So, we add to our prompt:
Fix the width of the first column and wrap text if names are too long.
Horizontally, show months starting from the current month, displaying 3 months into the future.
Each column represents a week, starting on Monday, and months should be labelled as “MM-YY”.
If no end date is provided, assume it ends 24 hours after the start date.
3. Consider Navigation: Specify Controls and User Flow
How will users move around the page? Good navigation is crucial for empowering users to explore, filter, or drill down into data. In your prompt, articulate the navigation controls you desire. For example, you might specify a left-hand navigation menu to switch between Gantt view, list view, and journey details. Or perhaps you want a filter panel atop the Gantt Chart, allowing users to pare down journeys by owner or status.
Beyond navigation, think about the controls that matter—search bars for journey names, dropdowns for status, or buttons to export data. If you don’t specify, the generative tool may default to basic layouts, which might not meet your needs. Deliberate navigation choices transform your generative page from a flat report into a dynamic workspace.
For the purpose of the example, we are simply adding buttons to navigate the timeline of the chart.
Add left and right arrow buttons above the chart on the top-right corner to shift the displayed months by one month backward or forward.
These navigation buttons must remain visible at all times.
4. Add Scrolling Where Needed
Don’t risk frustrating users with hidden or inaccessible data. Specify horizontal and vertical scrolling in your prompt to ensure all journeys and timelines can be reached. By explicitly stating scrolling needs, you’ll avoid static layouts that cut off information and frustrate users, especially as data grows over time.
Ensure the chart fits horizontally within the screen and scrolls vertically if there are too many journeys.
5. Attach or Reference an Image of the Desired Layout
They say a picture is worth a thousand words, and this is doubly true for generative pages. If you have a vision for your Gantt Chart, provide a wireframe, screenshot, or even a hand-drawn sketch with your prompt. This gives both the AI and human collaborators a concrete target.
Creating an image like the below will help guide the authoring agent.
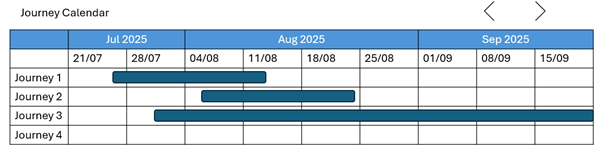
Creating an image like the below will help guide the authoring agent.
So, we can put together this image and full set of instructions
Create a responsive Gantt chart page using data from the Journey table in Dataverse.
Functionality Requirements:
Display a Gantt chart where the first column is titled “Journey Name”, showing journey names ordered by start date (descending).
Include all journeys with Status = “Live” or “Stopped”, even if they don’t have activity in the currently displayed months.
For each journey, draw a blue horizontal bar from the start date to the end date.
Bars must only appear within the currently displayed months and must not overlap the first column or extend beyond the last column.
Fix the width of the first column and wrap text if names are too long.
Horizontally, show months starting from the current month, displaying 3 months into the future.
Each column represents a week, starting on Monday, and months should be labelled as “MM-YY”.
If no end date is provided, assume it ends 24 hours after the start date.
Add left and right arrow buttons above the chart on the top-right corner to shift the displayed months by one month backward or forward.
These navigation buttons must remain visible at all times.
Ensure the chart fits horizontally within the screen and scrolls vertically if there are too many journeys.
And we are able to get a to a page that looks like this:
6. Iterate, iterate, iterate
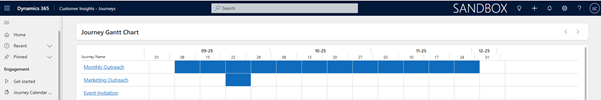
The outputted page above looks great for what is desired. However, it is possible that something was missed. For example, in the example the prompts have not accounted for the handling of a user click on the journey name. Once the page is created, we can add an additional instruction that will update the page.
Add drill-down when clicking the journey name. When the name is clicked navigate to the journey form for the journey.
Once this is processed, the output will change and the names are added as links.
But more importantly, this serves as reminder that the process of working with Generative Pages will be one of frequent iterations, adding instructions to fine tune the data, look and feel, navigation, etc. of the page.
Iteration is not only something to consider as the final touches. Working with prompts is an iterative process. The first attempts may not produce the desired results so be prepared to use the Start Over feature and start your prompt again. Because of this, it is recommended that you keep a copy of the prompt you are using and tweaking so you know what is working and not. You may also want to consider using M365’s Prompt Coach app (Prompt Coach) which can provide useful assistance in creating prompt that the generative pages are able to better understand.
*This post is locked for comments